

Candlestick charts are a powerful tool in technical analysis, providing vital insights into market trends, price movements, and trader psychology. Understanding the types of candles in trading can help both beginners and seasoned traders make better decisions in stock, forex, and crypto markets.
In this comprehensive guide, you’ll learn:
- What are candles in trading?
- How to read and understand candlestick charts
- Common and powerful candlestick patterns
- 3 and 5 candle rules
- Bullish candlestick patterns
- Access to candlestick pattern PDFs for deep learning
What Are Candles in Trading?
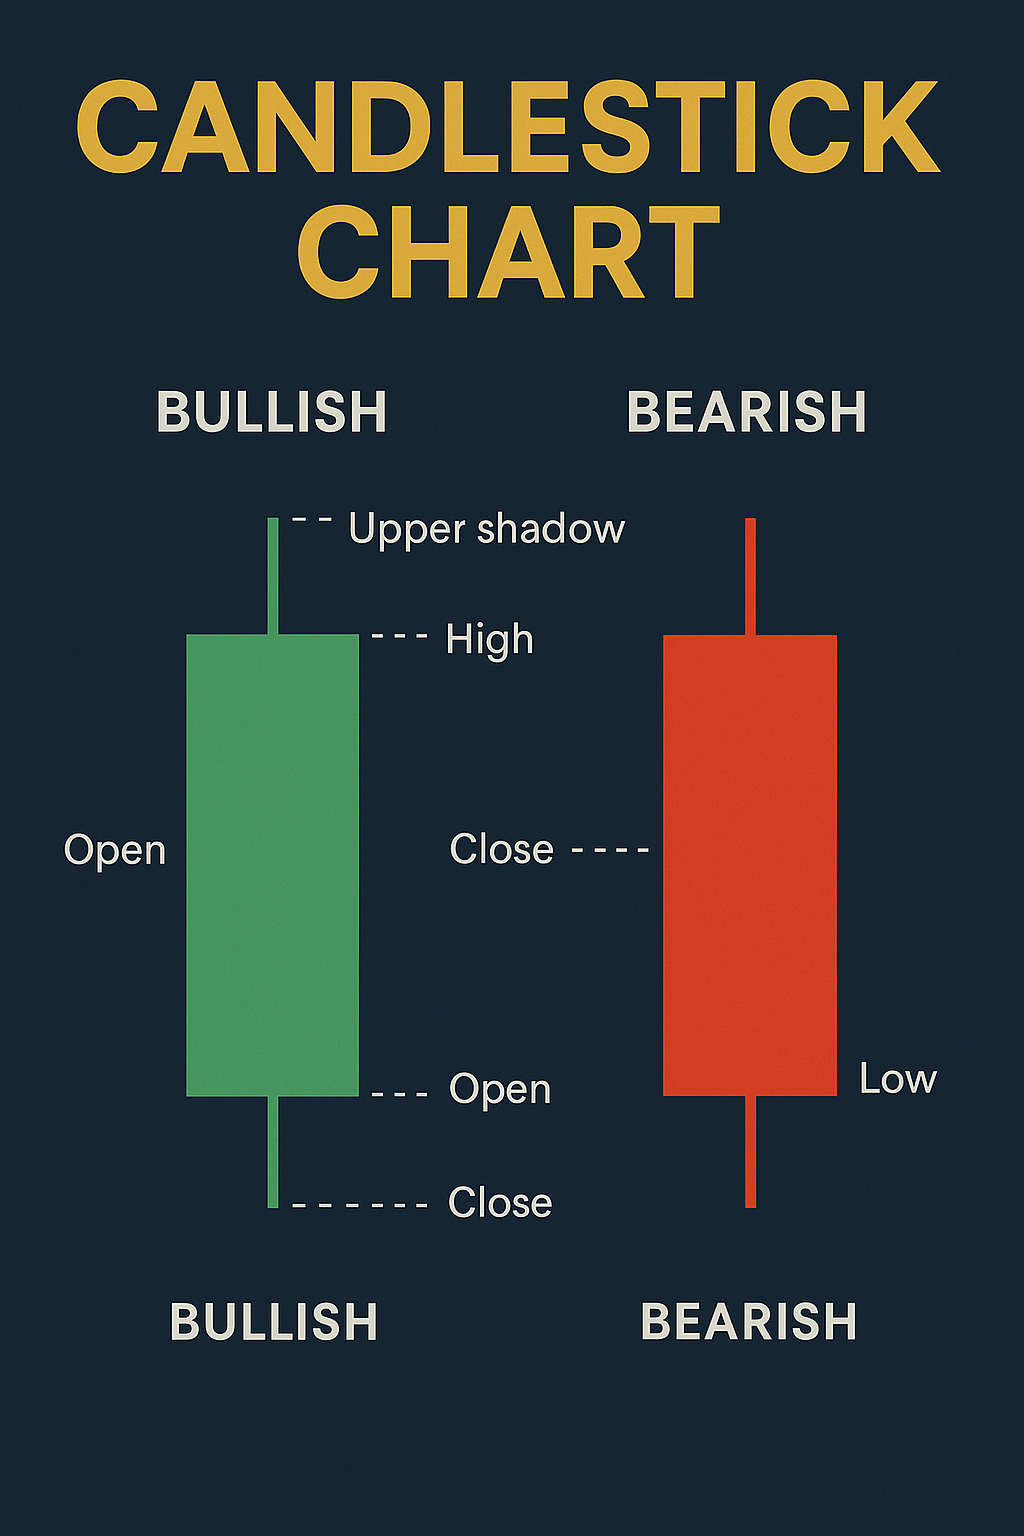
Candles in trading, or candlesticks, are visual representations of price movements over a specific time frame. Each candle shows four key data points:
- Open price
- Close price
- High price
- Low price
These elements help traders gauge whether buyers or sellers were in control during that period. A green (or white) candle typically shows a price increase, while a red (or black) candle signals a decrease.
Understanding Candles in Trading
Understanding how to read candles in trading is foundational. The body of the candle shows the range between the open and close. The wicks (also called shadows) represent the high and low prices during that period.
- Long body: Strong buying or selling pressure
- Short body: Price consolidation or indecision
- Long wick: Rejection of price in that direction
By recognizing these elements, traders can interpret market momentum and potential reversals.
Reading Candles in Trading
Here’s how to interpret common candle shapes:
- Doji: Open and close prices are nearly equal. Signals indecision.
- Hammer: Small body, long lower wick. Indicates a bullish reversal.
- Shooting Star: Small body, long upper wick. Often a bearish signal.
- Engulfing Candle: A larger candle fully engulfs the previous one. Signals trend reversal.
Mastering these patterns improves prediction accuracy and trade timing.
Which Candle is Best for Trading?
There’s no one-size-fits-all answer, but these are popular among traders:
- Hammer (bullish reversal)
- Engulfing candle (both bullish and bearish variants)
- Doji (when combined with volume or trendlines)
- Morning Star (three-candle bullish pattern)
Each candle has its significance depending on market conditions and timeframe.
What is the 3 Candle Rule in Trading?
The 3 candle rule is used to confirm trend reversals or breakouts. It suggests:
- Wait for 3 consecutive candles in the same direction to confirm a trend.
- Helps avoid fakeouts in volatile markets.
What is the 5 Candle Rule?
Similar to the 3 candle rule but allows for a broader timeframe. Traders use it to:
- Identify strong trends
- Confirm consolidation breakouts
- Reduce the chance of false entries
Bullish Candlestick Patterns
Recognizing bullish patterns can help time long entries. Some powerful bullish patterns include:
- Hammer
- Morning Star
- Bullish Engulfing
- Piercing Line
- Three White Soldiers
These patterns often appear at the bottom of downtrends and signal buying pressure.
Candles in Trading Strategy
Candles are not used in isolation. Here are ways to combine them into trading strategies:
- Candlestick + Moving Average: Confirm trend direction.
- Candlestick + RSI: Identify overbought/oversold conditions.
- Candlestick + Support/Resistance: Confirm price reactions at key levels.
Example Strategy:
- Wait for a bullish engulfing candle at support
- Confirm with RSI below 30
- Enter long with stop-loss below the pattern
Candlestick Chart Basics
A candlestick chart displays a series of candles representing different timeframes (1-min, 5-min, daily, etc.). Each candle gives context to market behavior:
- Trending vs. ranging markets
- Price strength
- Reversal points
Beginners should start with the daily chart to build accuracy before moving to smaller timeframes.
Candlestick Patterns for Beginners
Here are 5 easy patterns to start with:
- Doji
- Hammer
- Inverted Hammer
- Bullish Engulfing
- Spinning Top
Practice spotting them on live charts before trading real money.
35 Powerful Candlestick Patterns PDF
You can download this resource to learn how to spot:
- Single candle patterns
- Two-candle reversals
- Three-candle continuations
These PDFs include illustrations and trade examples to help you learn quickly.
All 75 Candlestick Patterns PDF
An advanced PDF guide for experienced traders includes:
- Lesser-known but effective patterns
- Market context explanations
- Historical performance studies
Look for these resources on trading websites or educational platforms.
Conclusion
Understanding the types of candles in trading gives you a solid edge in predicting price action. From learning basic shapes like Doji and Hammer to combining candles with other strategies, this knowledge empowers your decisions.
Whether you’re a beginner learning to read charts or an advanced trader applying the 5 candle rule, candlesticks are an essential part of every trader’s toolbox. Download candlestick patterns PDFs, practice with real charts, and build confidence in your trading strategies.
Start reading candles—not just prices—and transform how you trade.